Let's Graph With Probes
Focus for this activity
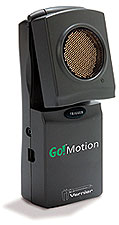
In this activity you will graph motion as it
changes over time using a motion probe that can measure and graph your motion
automatically. It's fun!
|
The motion you will study is the trip made by Vijay from the “Hanging with
Friends” story. You will construct a model of the street where Vijay travelled from the Library to the Cinema
then back to the Library. Then, you will be Vijay and walk his trip.
Remember from the story that the Cinema is 7400 meters from the Library. Don’t worry though, with your model you won’t have to move that far! You will lay out a “street” on the floor with masking tape and find and mark the locations of the Library and the Cinema. You will create Vijay’s trip by walking on the street while the probe tracks your motion and the computer creates the graph. |
Demonstration
Your teacher will now demonstrate the use of the motion probe.
Watch the graph during the demonstration, then answer the question below.
|
Prediction
One way to graph motion is to plot "position" as it changes over time. Position is
the distance of a location measured from a definite reference point. The reference point
could be any location that we choose, but once we choose it, it is fixed. We will call this reference point position 0
and give it the special name of “origin.”
Now, try drawing a graph that you think predicts how Vijay's position changes over time. Draw a line on the graph below that you think describes his trip. Click on the pencil tool at the right to draw your prediction line. Here is what you need to know to get started:
• The Library is located at the origin, position 0.
• The distance between the Library and Cinema is 7400 meters.
• Vijay travels from the Library to the Cinema and back to the Library.
After you have drawn your prediction, use the label tool (just below the pencil tool) to mark the positions of the Library and the Cinema on the graph.
Prediction Graph Results
After you have submitted your prediction graph on the previous page,
you will see some of your classmates' graphs below after your
teacher releases them. If the graphs are not visible yet, click the
Refresh button.
Reference points
As you have seen, in order to plot postion you need a reference point. For this activity, the reference point
is position 0, the origin. Let's say that the Library is located at the origin.
Vijay starts his trip at the Library then moves to the Cinema, so you will also need to know the Cinema’s position and the direction in which position increases.
For our model of Vijay’s motion we define:
• The Cinema is 1 meter from the Library.
• Position increases as we move from the origin toward the probe.
In the next step, you will actually walk on your masking tape "street" using the probe and graph to find the origin. It is at a distance has been pre-set on the probe.
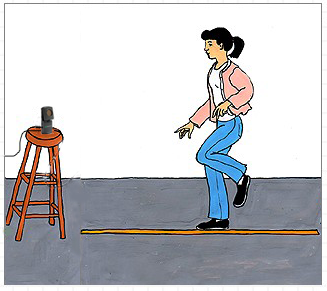
Find the Library!
How will you find the origin on your street? Try this:
Set up your motion probe at the end of a desk or table just in front of the masking tape “street.” While watching the graph, start the probe and walk along the street in front of the motion probe until you think you've found position 0, stopping and clearing the graph as needed.
Use a Post-It to mark the position of the origin and measure or estimate the approximate distance from the origin to the probe. Then submit your answer to the question below.
After you submit your answer, you'll be able to see the class' answers on the next page after your teacher releases them for viewing.
|
|
|
Library Location Results
Your class' answers should appear below as a histogram. If they are
not visible yet, click the Refresh button.
Your turn!
Without moving your probe, mark two locations on the masking tape "street" using Post-Its, one labeled “Library” and one marked “Cinema.” Remember that the Cinema is 1 meter closer to the probe than the Library.
Try walking Vijay’s trip several times, starting, stopping, and travelling at different speeds. Clear the data as you need to make several trips while watching the graph to see how different motions are graphed. Then answer and submit your answers to the questions below.
After you submit an answer, you will be able to see the class' answers after your teacher releases them. You will see the answers in a pop-up window that will appear after you click on the Results button.
|
|
Your Trip to the Cinema
Now plan and make a final graph of your trip to the Cinema as Vijay did. Here is his trip:
• Vijay starts at the Library.
• He proceeds to the Cinema.
• He returns to the Library.
• The whole trip takes 15 seconds.
Start the graph and walk Vijay’s trip several times clearing to erase previous graphs, until you have a graph that matches Vijay's trip and tht you are willing to share with the class. Then submit the graph for anonymous sharing by clicking the Submit button below the graph.
After you submit your graph, you'll be able to see some of the class' graphs on the next page after your teacher chooses several and releases them for viewing.
Cinema Trip Results
After you have submitted the graph on the previous page for your
trip to the Cinema, you will see some of your classmates'
graphs below after your teacher releases them. If the graphs are not
visible yet, click the Refresh button.
Discussing class graphs
Have a look at the class' graphs projected in front of your
classroom or in the results pop-up window (that appeared after
clicking the Results button at the bottom of the previous page).
Please answer and discuss the following questions. You may change
your answers after the class discussion.
Discussing graphs results
...
The End