Graphing Stories for Two
Making Motion from Graphs
In this activity you'll be exploring the relationship between graphs
and stories.
This activity will give you practice creating a graph from a story and telling the details of motions from a graph.
Finally, you will create your own story about a train traveling between several stations from a graph.
Go on to the next step.
Graphs Make Motion
New page content
The Pony Express
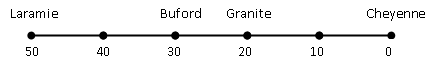
Laramie Wyoming is 50 miles west of Cheyenne. Along the way between
them there are two towns. Twenty miles west of Cheyenne is Granite and Buford is 10 miles beyond Granite. On
the route, there are mile markers every 10 miles as shown below. The
pony express needs to make a delivery from Cheyenne to Laramie.
Below is the story of how it traveled. Draw a graph that tells the
story of the Pony Express's trip.
• The Pony Express travels from Cheyenne to Granite in 2 hours.
• In Granite, the pony and rider take a 1 hour rest.
• Then they leave Granite and reach Buford in 1 hour, but there, the pony throws a shoe.
• To fix the shoe, they have to go back to Granite.  The pony has to limp back, so it takes 2 hours.
• In Granite they get a fresh pony, and leave for Laramie.
• There are no more stops, and the pony and rider arrive in 2 hours.
Place labels on the graph to show the approximate locations of the four towns, then Submit your graph.
Reflecting on the Pony Express Trip
Skip this step until you have discussed the Pony Express graph trips
on the previous step.
Return to this step after discussion with your teacher and / or classmates. After discussion, if you would like to revise your graph for the Pony Express trip, you may do it below and submit it.
• The Pony Express travels from Cheyenne to Granite in 2 hours.
• In Granite, the pony and rider take a 1 hour rest.
• Then they leave Granite and reach Buford in 1 hour, but there, the pony throws a shoe.
• To fix the shoe, they have to go back to Granite.  The pony has to limp back, so it takes 2 hours.
• In Granite they get a fresh pony, and leave for Laramie.
• There are no more stops, and the pony and rider arrive in 2 hours.
A Race!
The graph below tells a story about a race between Isabel and
Shanice. Use this graph to help you answer the questions. Click
submit after answering each.
|
|
Be sure to scroll to the bottom of the page and answer all four sequences of questions. |
Creating a story
The position of a train traveling between three
stations as it changes in time is shown on the graph below. Distances are in miles, and time is
in minutes. Station A is at position 0, Station B is at position 10,
Station C is at position 25. Create a story about a train trip that
matches the graph. Feel free to invent characters and actions. What
might have happened, for example, after 35 minutes?
After you submit your story you'll be able to see some of the class' stories on the next page if your teacher chooses several and releases them for viewing.
|
|
|
Thinking about Your Train Stories
Skip this step until you have discussed you train story with your teacher or class. Return to this step after discussion.
The End
When you are done, you may close this activity. Your answers are
saved automatically.
Graph Source data page
|
This page is to provide source data for the train story. It is
not for student use.
|
|
Notes to/from Author